What Does Eyetracking Show Us?
Eyetracking detects where a person’s fovea fixate and the movements in between fixations. The fovea is a small spot on the retina that is responsible for our fine, detailed vision. Outside the fovea, visual acuity decreases greatly. Our eyes constantly move in rapid bursts called saccades, with brief stops called fixations, during which we take in visual information through our fovea. We use our parafovea—the area just outside the fovea—and peripheral vision to determine where to fixate next.
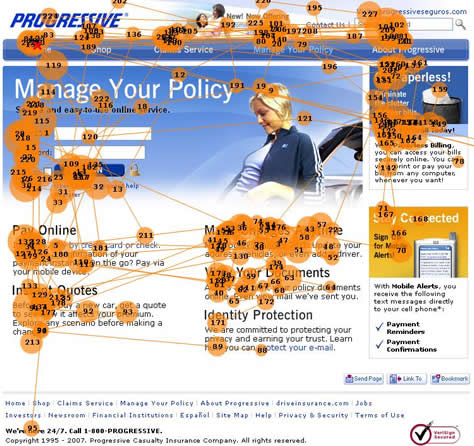
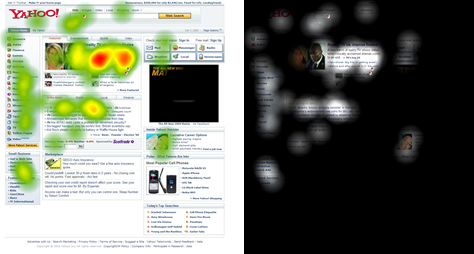
We can see these fixation points and saccades most clearly in eyetracking gaze plots. Figure 1 is a gaze plot of one study participant’s fixations and saccades during a task. The circles are the fixation points, where the participant’s fovea stopped briefly to take in information. The numbers indicate the order of fixations, and the size of each circle indicates the length of a fixation, with larger circles signifying longer fixations. The lines connecting the circles are the saccades, the movements between fixations.
Most modern eyetracking systems unobtrusively track participants’ eyes by reflecting near-infrared light off the eyes and detecting the position of those reflections to determine where the person’s fovea are fixated.
What Value Does Eyetracking Provide?
This may all sound pretty impressive, but what value can we really get from knowing where a person’s fovea fixated?
Helping to Identify Usability Problems
Eyetracking provides additional information to help you find and interpret design and usability problems. It is important to note that we should not use eyetracking data alone, but in conjunction with careful observation of participant behavior and discussion. Within this context, seeing where participants looked during a task provides additional insights into what they were doing and why.
Knowing where participants looked during a task is especially helpful in answering certain types of questions. For example, eyetracking data can help you determine the following:
- why participants had problems performing a task
- where participants expected to find certain elements
- whether participants noticed a particular element—such as a link, button, advertising, or something new added to a user interface
- whether elements are distracting in a negative way
- how efficiently a design guides participants through a task
- whether there are differences in task performance by user group—for example, between new users and experienced users
- which content participants read—including articles, instructions, contextual Help, and error messages
- how participants read—in detail or by scanning
- whether a particular design is more effective than another—in terms of user or business goals
For example, Figures 2 and 3 show an example of how a feature that its designers intended to be a helpful aid was actually a negative distraction. While filling out an online credit card application, participants were distracted by a Talk to a Specialist box, shown in Figure 2, that appeared and followed them down the right side of the page. The gaze plot in Figure 3 shows one typical participant’s fixation points (the circles) as she filled out the form. We can clearly see the three times when the chat box distracted her attention from the form. Without eyetracking, we would have observed only the third of these, when she finally closed the chat box. We would not have seen the previous two instances of distraction. The client had heard complaints about this chat box before, but it took eyetracking to show them how distracting it really was.

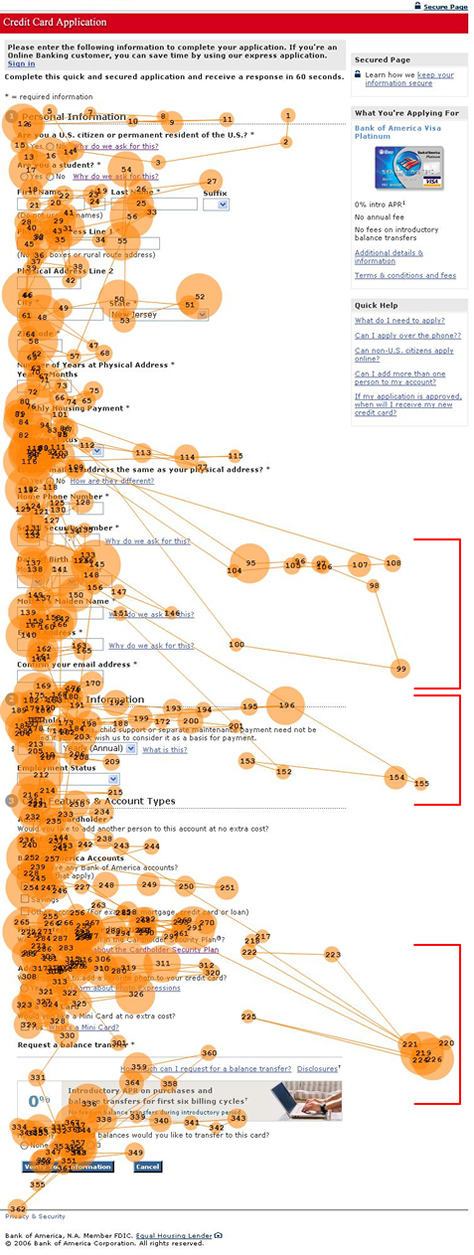
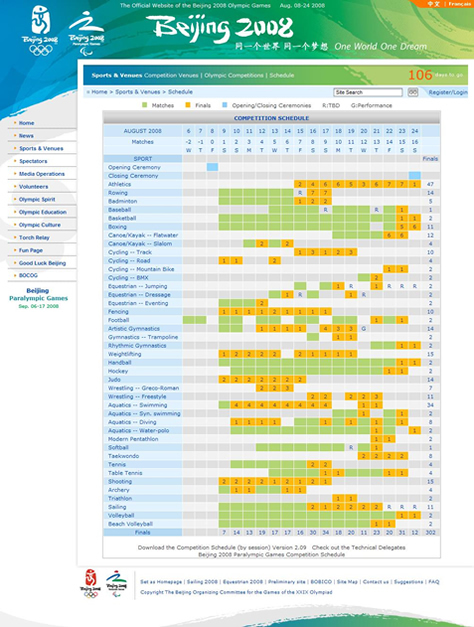
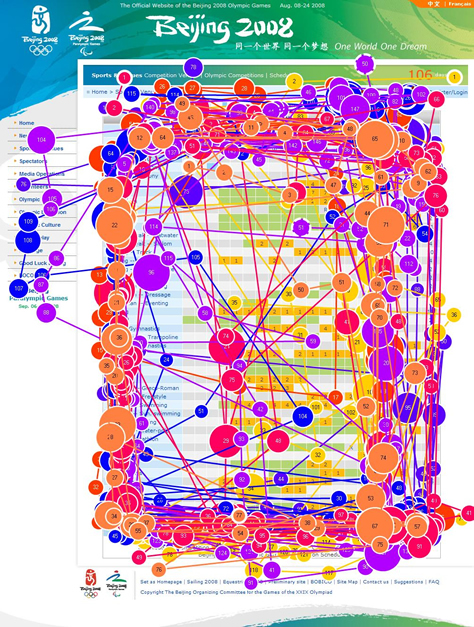
Figure 4 is an example of how eyetracking can show whether a design guides participants effectively through an information seeking task—in this case, finding the dates of the beach volleyball finals on the 2008 Beijing Olympics schedule. The gaze plot in Figure 5 shows the common and extended visual paths of multiple participants as they tried to find the dates on this confusing schedule. Clearly, the design of this schedule needed major improvements.
Showing Hard-to-Articulate Behaviors
Eyetracking can help us identify behaviors that participants cannot articulate. If you ask participants whether they noticed a particular element or why they had a problem, they often have a hard time accurately and reliably answering such questions. We make many of our eye movements unconsciously, so it is difficult to report what we looked at, for how long, or in what order. Having participants think aloud during tasks or retrospectively after completing tasks provides valuable insights into their thought processes and behavior, but these are consciously filtered explanations. Eyetracking shows you participants’ actual eye movements, without any conscious filtering.
Providing Additional Insights
In addition to the data eyetracking provides for later analysis, watching the live view of the eyetracking data during usability testing provides a facilitator with additional insights—like a sixth sense—into what a participant is doing. This additional understanding helps the facilitator ask more relevant questions and, thus, get more insightful information.
Visualizing Data for Observers
The live view of the eyetracking data provides a great visualization for observers during usability testing. Observers can see the live view of the eyetracking data, which makes it much easier for them to follow and understand what is happening during testing. Seeing a participants’ eye movements provides much more information that just seeing a mouse pointer moving around the screen. Because eyetracking makes observing a usability test much more interesting and engaging, observers tend to pay closer attention and get more value out of observing the tests.
Exciting Clients and Team Members
Eyetracking studies excite clients and project team members. Observing live eyetracking and viewing the resulting visualizations is exciting. Eyetracking gets clients and project team members interested in observing more tests and doing more usability testing. That, in itself, is a good thing!
Providing Compelling Visualizations of Usability Problems
Eyetracking provides compelling, obvious visualizations of usability problems. Eyetracking visualizations are often a great way of demonstrating usability problems. You can describe usability problems much more powerfully—and in a way that’s visually obvious—with a good eyetracking visualization than in words alone. For example, the following sentence is much more salient when a gaze plot accompanies it: Participants had a difficult time finding the link to register for access to their auto insurance policy. The gaze plot in Figure 6 shows the extensive path a typical participant took while looking for the Register link.
