Top

Dashboard Design 101

User Assistance

Putting Help in context

A column by Mike Hughes
November 8, 2010

The explosion of information that analysts and executives must consume, as well as the increasing variety of sources from which that information comes, has boosted the popularity of information dashboards. Modeled after the dashboard of a car or airplane—which informs its operator about the status and operation of the vehicle they’re controlling at a glance—dashboard user interfaces provide a great deal of useful information to users at a glance. Typically, the role of an information dashboard is to quickly inform users and, thus, enable them to take immediate action.

For example, a sales executive might use a dashboard to compare current sales levels to plan or levels at the same time last year, as well as to see the current volume of orders in the sales pipeline—that is, orders his salespeople are working on, but have not yet closed. Using that same dashboard, he could compare that information across the various sales regions and respond quickly if indicators showed a potential problem brewing in a particular region or a general slow-down across the enterprise.

Champion Advertisement
Continue Reading…

Or a security analyst could use a dashboard to quickly assess the general vulnerability of a network and which devices are sustaining high or increasing levels of attack. He could then respond by doing more in-depth forensics to shore up vulnerabilities in the network’s defenses or determine whether attacks have breached security.

Information dashboards can be very valuable to users. Unfortunately, dashboard design often follows the following progression:

  1. A product manager recognizes the need for a dashboard or hears people talking about dashboards at a happy-hour networking event and adds this requirement: “Product shall include a graphical dashboard on the home page.”
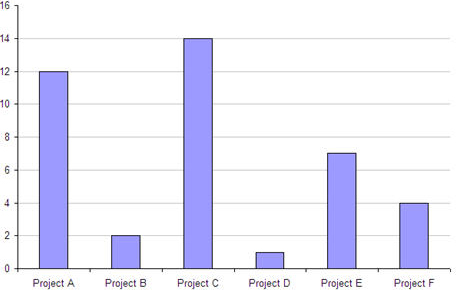
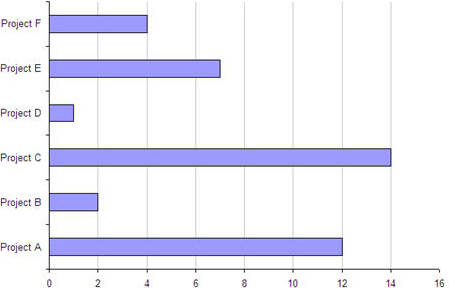
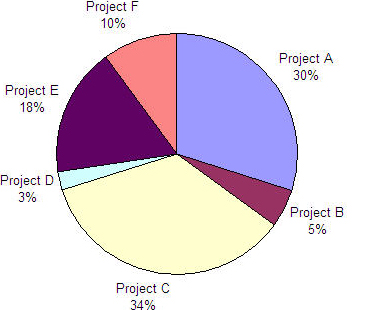
  2. Engineering scours the database schemata to see what data the system collects and displays it in bar charts and pie charts on a dashboard.
  3. Someone decides the dashboard needs to be more graphically appealing, so Engineering renders all of the charts in 3D and adds more colors. If the team includes a graphic artist, perhaps that person designs widgets that emulate the kinds of dials one might find on an actual car dashboard, then says, “Get it? It’s a dashboard!” at the stakeholder walkthrough.

We can do so much better than this. The purpose of this column is to investigate how UX professionals can improve on the all-too-typical process I’ve described and drive product teams toward meaningful dashboard design.

In Information Dashboard Design, Stephen Few offers the following checklist for designing dashboards:

  • Organize the information to support its meaning and use.
  • Maintain consistency for quick and accurate interpretation.
  • Make the viewing experience aesthetically pleasing.
  • Design for use as a launch pad.
  • Test your design for usability.

For more about Stephen Few’s perspectives on information dashboard design, read Pabini Gabriel-Petit’s in-depth review of his book, Information Dashboard Design: The Effective Visual Communication of Data.

In this column, I’ll embark on a two-part discussion of dashboard design from a UX perspective. The focus of this column is on how to analyze user requirements and define actionable design goals for information dashboards and how to represent data on them, giving an overview of the more common graphic elements for displaying data in meaningful ways.

Analyzing User Requirements for Dashboards

Here are some high-level questions and considerations that should guide the analysis process:

  • What data should we display?
  • Where should we place the data?
  • What kinds of interactions do we need to support?
  • How should we represent the data?

Let’s look at answers to each of these questions.

What Data Should We Display?

UX professionals can help their product teams avoid an initial scavenger hunt for data to display on a dashboard by getting their teams focused on user needs. Asking the following questions can be helpful in determining what data to show on a dashboard:

  • What is a particular user’s main reason for visiting the dashboard? Is the user making a decision or reacting to specific events or situations?
  • What triggers a user’s visiting the dashboard? What happens that prompts the user to view the dashboard? Is there some information the user would routinely review at the start of a work day? Or would a user go to the dashboard in response to a system-generated email alert?
  • How frequently would a user visit the dashboard? Once a week or several times a day?
  • What is a user trying to assess? Does the dashboard answer questions such as How are we doing? If so, complete that question: How are we doing at what?
  • What critical decisions does a user have to make? For example, would the dashboard inform the user about any reallocation of resources? If so, it needs to make the most critical information available to help the user make an informed decision.
  • Are there conditions of which we need to alert a user? For example, an industrial control dashboard might alert the user that a critical parameter is out of range. This is similar to the gas gauge or engine-temperature gauge on a car’s dashboard, which not only informs a user about a quantitative state, but alerts the user if the amount of gas in the tank is low or the engine temperature is too high.

Where Should We Place the Data?

You need to decide how to arrange the data on a page—not based on the aesthetics of the page, but on the ways in which the information flow must support users’ workflows. Get answers to the following questions:

  • What are the critical must-see or must-do items? Give these items prominent placement and stronger visual treatments.
  • What is the likely flow of a user’s focus? Graphic elements pull users’ focus downstream.
  • Is there a logical grouping scheme? Express groupings visually.
  • Would a user want to compare some data with other data? Place comparative data side by side.

What Kinds of Interactions Do We Need to Support?

An information dashboard is not eye candy. It needs to support some user goal or interaction. So you need to determine what users’ next actions might be and design a dashboard to accommodate them.

  • Would users want to drill down to more detail? For example, if a chart aggregates data, might a user want to see the respective sources of that data?
  • Would users want to solve an identified problem? For example, if a dashboard alerts a user to a fault, would the user want to open a support ticket?
  • Would users need conceptual or verbal information? For example, if a security dashboard shows that the system has detected a specific attack signature, might a user need to see a description of that particular attack vector?

How Should We Represent the Data?

Here’s a quick guide to the basic data-presentation options for information dashboards.

Vertical Bar Charts

Use a vertical bar chart like that shown in Figure 1 when users need to compare values or occurrences among nominal variables or frequencies—for example, security events by device or aggregated clusters such as sales volumes by product line. If the aggregated clusters are time periods, a vertical bar chart can also show trends. If the primary purpose of a chart is to show trends, consider using a line graph instead.

Figure 1—Example of a vertical bar chart—Time Spent on Projects
Example of a vertical bar chart—Time Spent on Projects

Horizontal Bar Charts

As with vertical bar charts, use a horizontal bar chart like that shown in Figure 2 when users need to compare values or occurrences among nominal variables. Horizontal bar charts make it easier to read the labels. Do not use horizontal bar charts to show time trends.

Figure 2—Example of a horizontal bar chart—Time Spent on Projects
Example of a horizontal bar chart—Time Spent on Projects

Pie Charts

Use a pie chart like that shown in Figure 3 when users need to see proportional distribution—for example, to answer the question “How are sales distributed across the sales centers?”

Figure 3—Example of a pie chart—Distribution of Time Spent on Projects
Example of a pie chart—Distribution of Time Spent on Projects

Most experts on the graphic display of data argue that pie charts are the most abused data-display device. Edward Tufte supposedly said that the only thing worse than a pie chart was two pie charts.

The inherent problem with pie charts is that humans cannot effectively compare area or circular representations as well as they can compare linear representations of data. In the bar chart and pie chart examples, compare the same data for projects B and F. Most people can make a more accurate comparison using bar charts.

Line Graphs

Use a line graph like that shown in Figure 4 when users need to see values and trends over time—for example, to see whether something is increasing, decreasing, or staying the same. Also, use a line graph when users need to determine relationships between independent and dependent variables—for example, a server’s transaction rate and response time.

Figure 4—Example of a line graph showing a trend—Open Support Issues
Example of a line graph showing a trend—Open Support Issues

Do not use line graphs for nominal variables where users are more interested in the frequency distribution. For example, the graph shown in Figure 5 would work better as a bar chart.

Figure 5—Example of the inappropriate use of a line graph—Educational Level of Survey Respondents
Example of the inappropriate use of a line graph—Educational Level of Survey Respondents

In Dashboard Design 201, I’ll discuss more specialized—and less familiar—devices such as sparklines, bullet graphs, and tree maps, as well as multiple line graphs and stacked bar charts.

Making Graphs More Readable

Stephen Few, elaborating on Tufte’s principle of minimizing the ink-to-data ratio, offers the following guidelines:

  • Reduce the non-data pixels.
    • Eliminate all unnecessary non-data pixels.
    • De-emphasize and regularize the non-data pixels that remain.
  • Enhance the data pixels.
    • Eliminate all unnecessary data pixels.
    • Highlight the most important data pixels that remain.

The first principle, reducing non-data pixels, is an obvious place where even graphically impaired UX folks, like me, can quickly add value.

The bar chart in Figure 6 shows the default rendering in Excel. The border and the shaded background are visual elements that compete for the viewer’s attention, but add no informational value. Let’s just eliminate them, as shown in Figure 7.

Figure 6—Chart with unnecessary, non-data pixels
Chart with unnecessary, non-data pixels
Figure 7—Chart with the unnecessary non-data pixels removed
Chart with the unnecessary non-data pixels removed

Another visual enhancement I made was toning down the grid lines to a softer gray—de-emphasizing the non-data pixels that remained.

An example of eliminating unnecessary data pixels from a chart would be taking data that was originally precise to three decimal places and rounding it off to a more reasonable level of accuracy based on what users need.

Conclusion

Information dashboards are easy to design poorly, because developers can grab a lot of irrelevant data and display it badly. Therefore, many opportunities exist for UX professionals to apply user-centered design principles to make dashboard data more relevant to users and provide graphic displays that communicate more effectively. 

References

Few, Stephen. Information Dashboard Design: The Effective Visual Communication of Data. Sebastopol, CA: O’Reilly Media, 2006.

Gabriel-Petit, Pabini. “Book Review: Information Dashboard Design.” UXmatters, April 9, 2007. Retrieved October 22, 2010.

UX Designer at TSYS

Atlanta, Georgia, USA

Mike HughesIn his role as User Experience Architect for IBM Security, Mike’s professional focus is on designing usable user interfaces that accommodate the user as learner. Previously, as User Assistance Architect at IBM, Mike identified tools, methods, and standards for integrating the content and delivery of user assistance, including documentation, Help, elearning, and training. He was formerly Lead UX Designer for CheckFree Corporation, where he instituted their User Experience Research and Design Center. Mike has a PhD in Instructional Technology from the University of Georgia and a Masters in Technical and Professional Communication from Southern Polytechnic State University. He is a Fellow with the Society for Technical Communication and a Certified Performance Technologist through the International Society for Performance Improvement.  Read More

Other Columns by Mike Hughes

Other Articles on Information Design

New on UXmatters